
What's under the grass, already mapped.
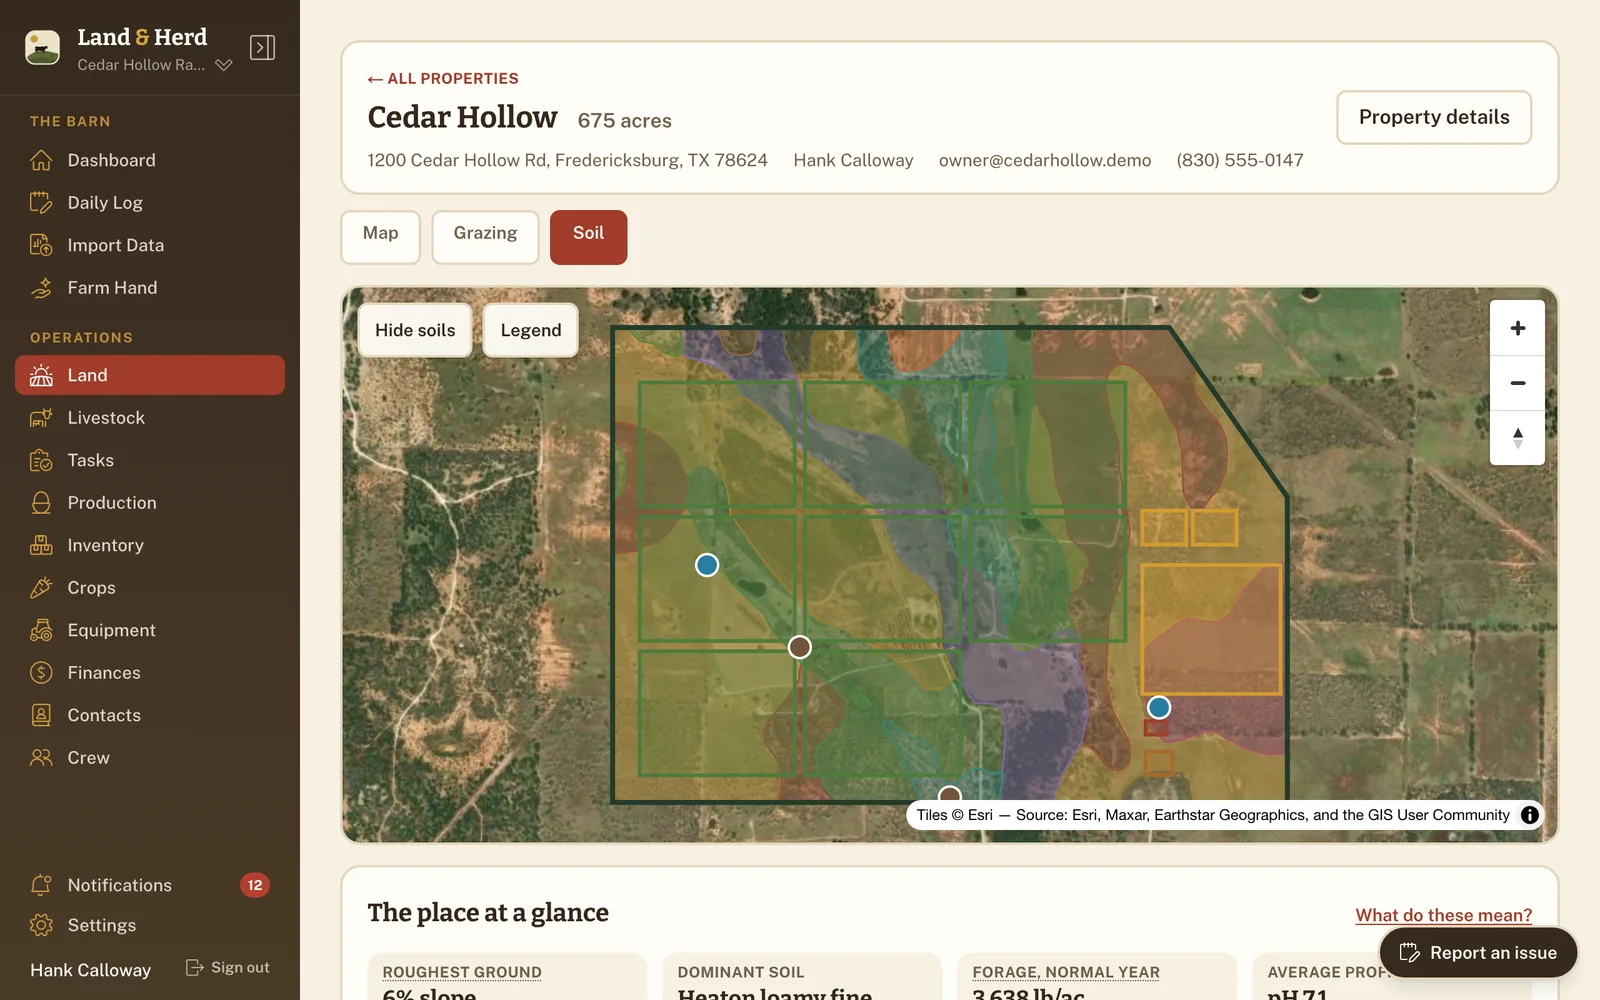
The USDA has surveyed American soil for a hundred years, and the survey for your place is public. Draw a property and the Soil tab fetches it — the soils under your paddocks (a fenced grazing section), how much of the place each covers, and what the government reckons that ground will grow.
The place at a glance
The summary is what you'd ask standing at the gate:
- The dominant soil and what share of the surveyed ground it covers.
- Forage in a normal year, in pounds per acre, with the bad-year and good-year figures beside it.
- The average profile — pH and organic matter, weighted by acreage.
- The roughest ground — the steepest map unit and its share. Where USDA's map stops short of your boundary, that slot says how much it didn't reach instead.
The forage number is USDA's published growth for those soils, with no harvest efficiency and no stocking assumption applied — it says so on the screen. What you can take off it is your judgment.
A soil map on the same ground as your fences
Map units are drawn on the same satellite map as your pastures and gates, so "the heavy corner" becomes a shape you can point at. Tap one and it opens:
- This ground — acreage, share of the property, and the dominant slope.
- The soils in it — usually a mix, named with their percentages.
- The profile by depth — clay, sand and silt, pH, organic matter, available water capacity, rock fragments, salinity, horizon by horizon.
- What USDA says it will take — the published interpretations and their ratings.
Every term that isn't plain English carries a note. Nobody should need an agronomy course to read their own dirt.
A soil report you can hand to somebody
The whole survey prints as a PDF soil report, per property — for a lender, a leaseholder, or an NRCS agent. It's built from the survey already stored on your property, so printing never waits on a government server.
What this is, and what it isn't
This is USDA's survey of the ground under you, not a test of your soil — the same public data an agent would look up, put on your own map and measured against your own acreage.
- It isn't a lab result. Nothing here replaces pulling samples — soil tests tell you about this year; the survey tells you about the ground.
- It's American ground only. Ask for a property outside the United States and its territories and it says so plainly.
- Not every acre is mapped. Some corners USDA never surveyed; you're told how much of the boundary it reached.
It's on every plan
Soil follows the land map, which is on every plan including free. No credit to spend, nothing to switch on — draw a property and the survey arrives on the next view.
What this connects to
Land & properties
The map the soil survey sits under — properties, pastures, pens, water and gates, each with its acreage.
Land & properties →Rotational grazing
What the grass on those soils has had for rest, and which paddock is ready.
Rotational grazing →Documents & export
The soil report is one of eight printable documents.
Documents & export →Find out what you're standing on
Draw a property and the survey comes back on the next view — no credit to spend, nothing to switch on.